
Let’s analyze the market situation of 2023 and what can happen in 2024 based on some exclusive charts and analysis. We give our opinion, but we do not recommend buying anything, invest according to your criteria. We have used the Tradingview platform to get these charts.
The first thing we are going to look at is the evolution of the US 10-year bond and interest rates. Except in very specific cases, in short periods and recession, interest rates are below the 10-year bond as we see in the graph. The orange line corresponds to the interest rates and the blue one with the bond. At the bottom we see the subtraction of both, where the white line is zero.
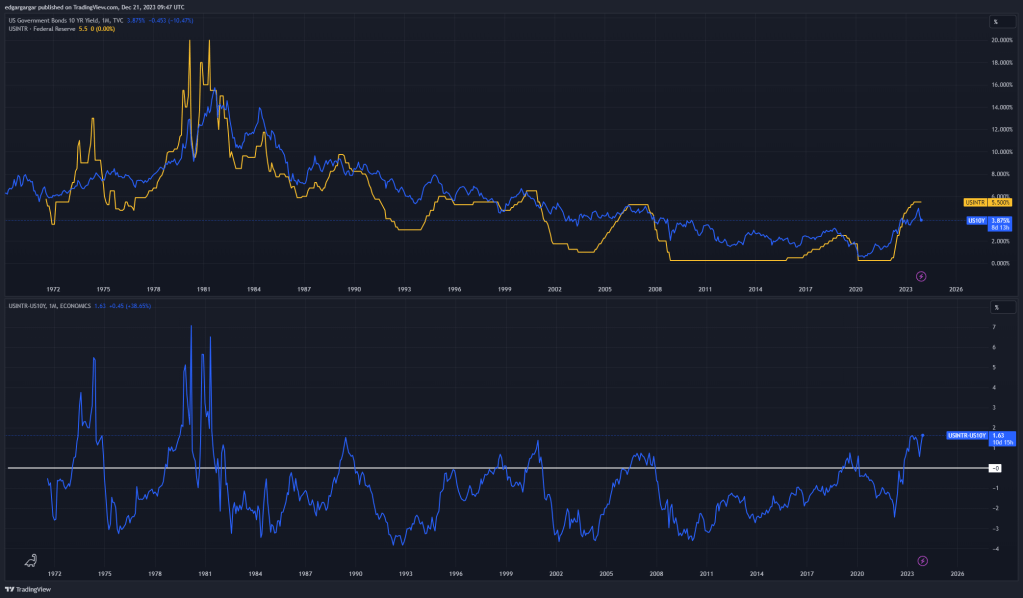
The value of the bond corresponds to the interest that the state pays for borrowing. This interest may vary depending on the country’s risk of being able to repay that debt and/or due to competitiveness with other products in the market. In principle, a country like the United States should not pose a risk to repay its debt, except at very specific times of high uncertainty. But when inflation is high, other low-risk assets become very attractive, which forces the state to raise the interest it pays on its debt.
The case of interest rates is different. They are decided by the central bank. When inflation is controlled, it leaves them below the public debt in order to be able to buy debt and receive more interest than they pay for the rates. But when inflation is high, the Fed (Federal Reserve) sells debt and raises rates to cut the issuance of money. If the rates remain above the debt, the Fed can sell the debt and get higher interest on the loans.
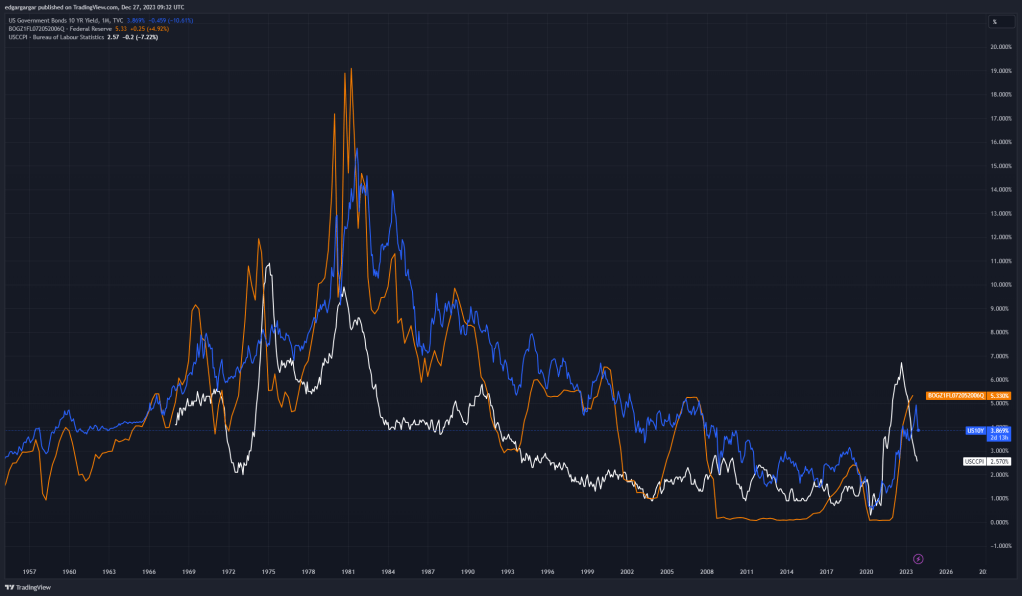
If we add the inflation in white to the first graph, we see that the public debt (in blue) has almost always been above inflation, except between 2021 and 2023, and between the years 74 and 75. Interest rates (in orange), however, changed this trend in 2008, falling below inflation for more than 10 years. The fact of having relatively low rates has caused a lot of money to be borrowed, and invested in riskier assets such as the stock market. Now saving is being encouraged more, and growth and investments are being penalized through debt, including to the State.
Inflation at the economic level does not matter much to the central bank, but it does matter that there is no demand for public debt. In order for the interests of bank savings products, and those of public debt to be attractive, they have to be above inflation, so that they result in a real profit for their buyer. That is why rates and bonds have been raised above this inflation, in order to make it profitable for the investor to have the money in the bank or invested in debt.
The central bank announced that it was going to raise rates in advance, which caused greater demand for credit and fixed-rate mortgages, before interest rates increased.
The following graph shows how in periods of low rates, the demand for mortgage loans increases, as well as the rebound that occurred in 2021 before the rise in interest rates, or at the beginning of them during 2022.

The peaks in loan increases created more liquidity from the end of 2022 to the beginning of 2023.

When rates are already considered to be high, and that the next movements are going to be downward, new loans are not demanded, since it is expected to get better conditions later, when rates go down. This causes liquidity to be reduced, and this is what may happen in the coming months. In addition, the existing liquidity will tend to go more to savings than to the markets.
On the contrary, there has been another force that has kept liquidity high. After the pandemic, a lot of liquidity was generated by the central bank, and the funds accumulated too much in the REPO market. In recent months they have made use of it, greatly reducing the amount of money in this REPO market.

And there has been an important turning point in the markets and it is called Artificial Intelligence (AI). This is an asset that has been deemed safe. Technology is a hard and indispensable asset nowadays, and the emergence of new AI solutions, has meant that a lot of liquidity goes to the markets, especially to a few companies like NVIDIA, as seen in the chart.

This has caused a divergence between the liquidity that was falling and the stock market that was rising, during the last months of 2023, as can be seen in the following chart, where we see the evolution of the stock market above, and that of liquidity below.

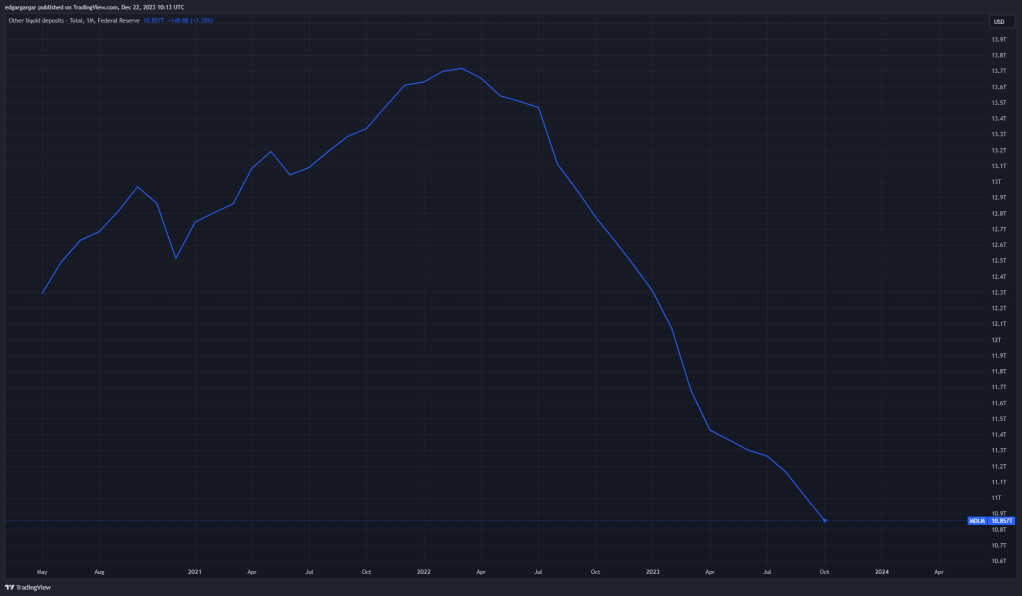
This is not normal, but we are coming from a time of great increase in liquidity since the pandemic until the third quarter of 2021. This liquidity is being consumed. The rise in the market from 2020 to today is equivalent to what liquidity has risen in the same period. The Federal Reserve offers a data of liquid assets, which is currently around 10 trillion, after having fallen by 30% in two years.
To this should be added the share repurchases that the companies themselves make in the markets. If we see the reduction index of listed shares in blue, we observe a large increase today, and a correlation with the market value, in orange, very large.

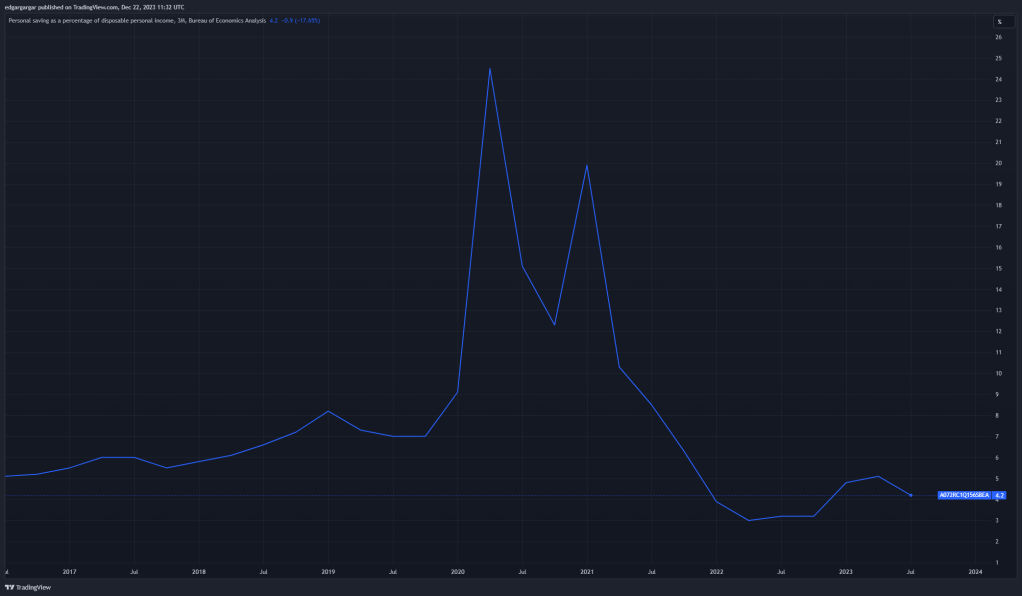
As for the ordinary citizen, there are few savings left to invest already. They increased with the pandemic, but now the consumer has saved 4% of what he enters, less than before the pandemic.
In addition, it must be taken into account that debts have to be paid and that inflation has risen a lot in the last two years. We have already mentioned in other episodes, the existing high debt. In the graph we see how the public debt, in blue, and that of companies, in orange, have increased in the last five years.
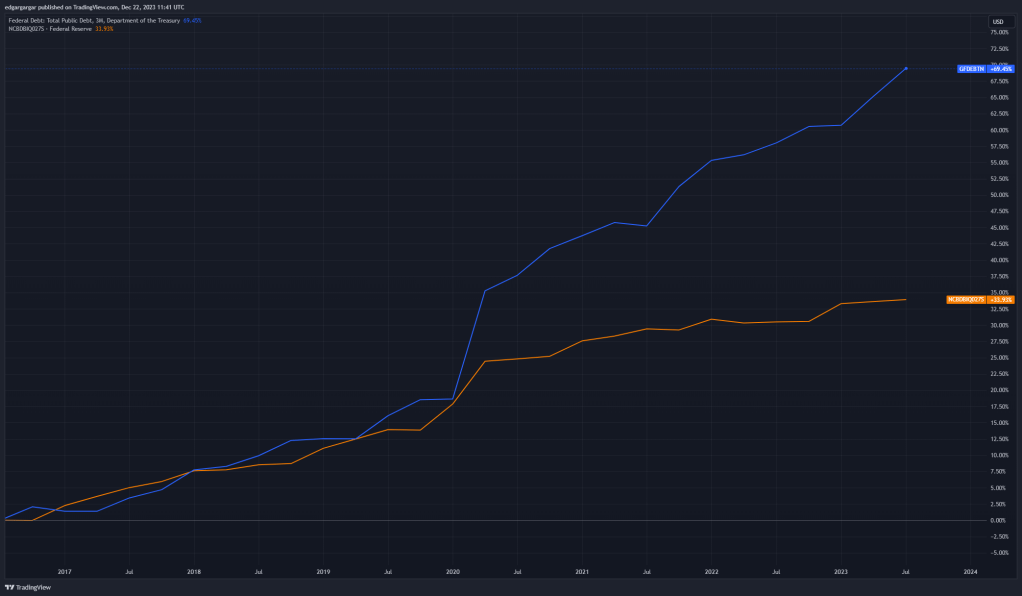
With the recent increases marked by AI, there are fewer and fewer stocks left to invest in at a good price. Liquidity is dwindling and there are a lot of debts to pay.
Don’t forget to subscribe if you are liking the content.
What are we waiting for 2024?
OPINION 1

The market is waiting for the Fed to lower rates and help it, but we have not yet seen inflation stabilized at 2%. Both the prices of raw materials, with international conflicts, and those of wages, exert upward pressure. I don’t think there will be many rate drops in 2024. We have seen in the graph, periods where rates have been well above inflation, and this may happen again. I think, on the other hand, that there will be liquidity to invest. I predict volatility. A lot of money will go to savings, but share buybacks and trying to take advantage of some falls, will make the market stay or even rise slightly in 2024.
According to economists like Shaikh, inflation depends on the capacity for economic growth and production capacity. Production capacity will be a problem from the end of 2025, when there will be shortages in the energy supply, for all demand. So, growth will be cut, even if central banks print a lot of money.
OPINION 2
We have seen that the Fed cares about inflation only if it affects the banks or the debt. But deflation does worry him, and a lot. A continued deflation supposes an incentive to keep liquidity, not to consume and, therefore, to stop the economy. With continued high rates there may be a recession, and they will have to take measures. But they will have to be sure that these measures are not going to generate deflation. The easiest way is to inject liquidity, and this is what they are going to do, even if they do not lower rates too much.
We will see a drop in the markets of more than 30% in 2024. The debt will be paid off with more debt and central banks will have to inject liquidity. The government will not be able to generate employment, and the fall in consumption will increase unemployment, the final trigger to start a recession. Business results will get worse.
This will cause commodities and Bitcoin to rise.
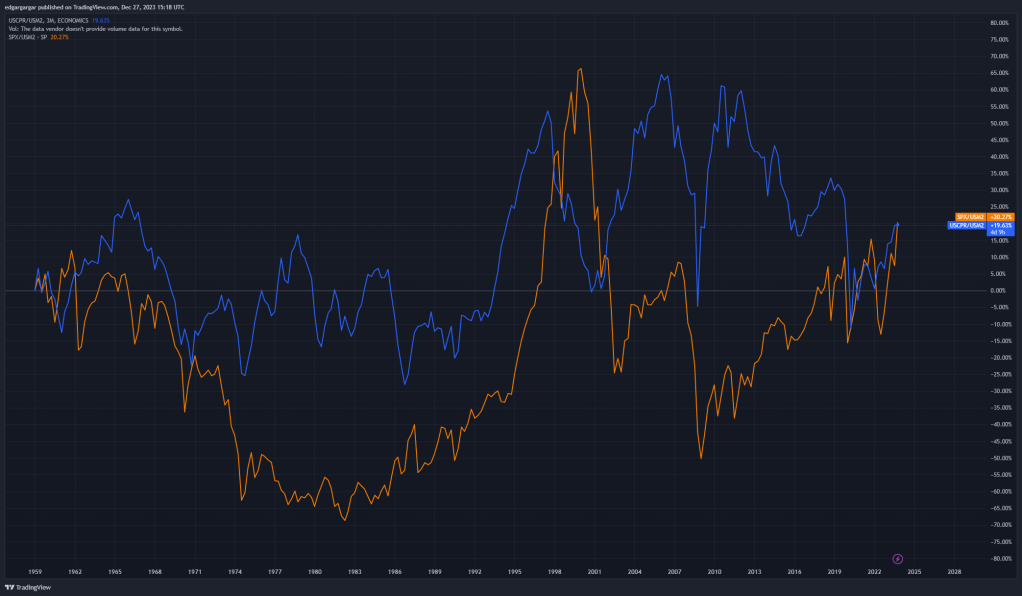
In the graph, the blue line represents the corporate profits weighted with the money supply. He has had very marked cycles of rise and fall of between 4 and 9 years approximately.
The orange line represents the value of the American stock market index «SP500», also weighted by the money supply. It has normally been in negative and has only exceeded corporate profits in the late 1990s, in a clear sign of a stock market bubble. Since 2010, there has been confidence in the stock market and now it has reached the logical point where profits and the stock market have risen practically the same. I think that in times of uncertainty, with high rates, we will return to the past seeing the stock market below corporate profits, even if these decrease.
OPINION 3
I think a big collapse of FIAT money is coming. A lot of debt that has to be paid off with more debt, but with high rates. Many of the assets that support the system are at risk of devaluation, and only supply cuts are saving them. The public accounts are not in a position to guarantee a good economic course, nor are the private ones.
Many countries will not be able to bear having to face debt maturities, and finance consumption. Your coins will lose a lot of value. We will see major bankruptcies. It will be necessary to reset some economies, taking Bitcoin or gold as a reference.
I think we will see volatility in Bitcoin at the beginning of the year, with ups and downs between 30,000 and 50,000. But after a process of value discovery, it will rise strongly from about August.
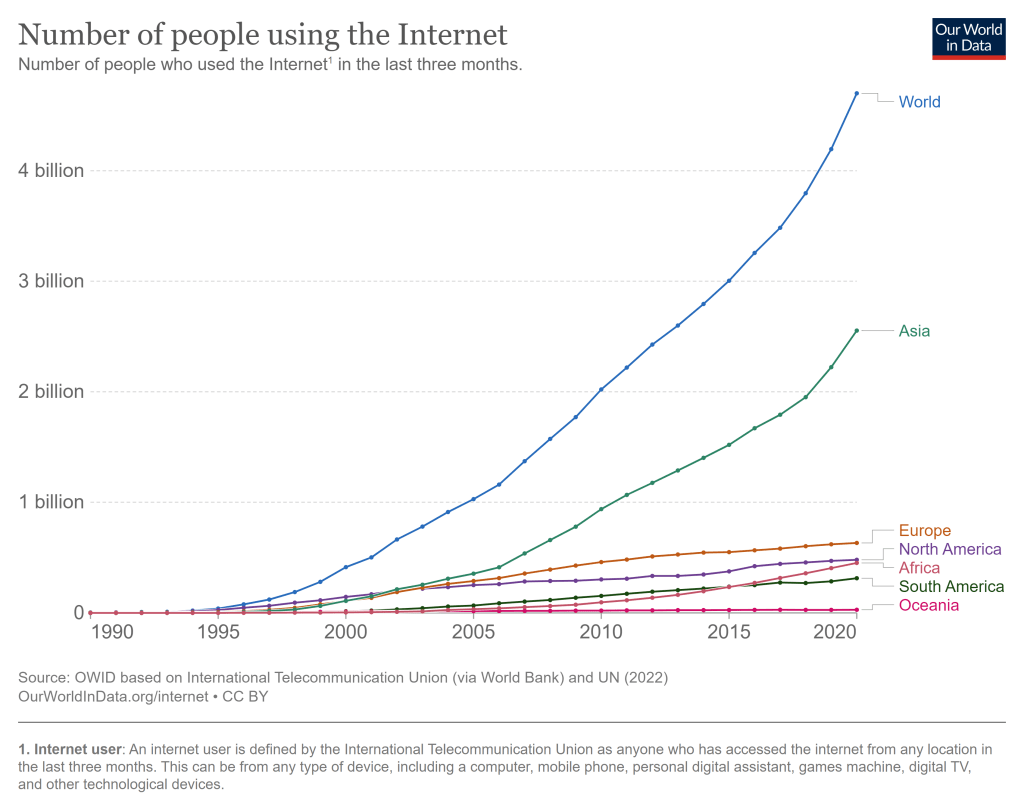
Many more people are going to adopt Bitcoin. The number of users is going to start rising exponentially in its 15th year, as happened with the Internet. Within cryptocurrencies, we may see big increases due to technological advances and also greater market penetration, but Bitcoin is a good bet.
CONCLUSION
We are facing economic policies of recession, but this one has not yet occurred. We think he’s going to be here not too late.
On the other hand, we may be facing a scenario of prolonged inflation, or that in 2024 a deflation arrives that completely changes the economic outlook. In any of these cases, it seems that Bitcoin and gold can benefit, and be the safe bet this year.
Don’t forget to subscribe and leave your opinion.
References:

Deja un comentario